Data analytics is a process of examining large amounts of data to convert it into useful insights that can help us make better decisions. In today’s data-driven world, industries and organizations of all sizes realize the importance of data analytics. The ability to acquire, handle, and analyze data has become a vital component of success due to the increasing rise of digital data. Businesses can obtain important insights into their operations, customers, and markets by employing data analytics, allowing them to make data-driven decisions and achieve their desired objectives. In this context, it is critical to understand the different forms of data analytics and their applications.
Data is a collection of raw facts and figures, whereas information is the meaning that we derive from data. In other words, data is like a raw material, and information is the finished product that is created from that raw material. Data by itself is not very useful, but processing and analyzing it can provide valuable information and insights that help us make better decisions.
An example of data may be a spreadsheet with ‘dates’ in column 1, ‘number of items sold’ in column 2, the ‘price’ in column 3, and ‘quantity’ sold in column 4. Each row represents one sale, and all the rows and columns put together make up a company’s sales data. This data is just a collection of raw facts and figures, without any organization or interpretation.
However, if you start to analyze this data and organize it in a meaningful way, you can start to derive useful information from it. For example, you might create a graph that shows the company’s sales over time, or you might group the data by product category to see which products are the most popular. By doing this, you are creating information and insights from the data.
There are four types of data analytics that every good manager should be aware of:
Descriptive Analytics:
Descriptive analytics is the simplest form of analytics that aims to describe past and present events. It involves examining data from past or current events to identify patterns, trends, and insights. Descriptive analytics is useful in answering questions about ‘what has happened’ and ‘what is currently happening’. Examples of descriptive analytics include generating reports on sales data, customer demographics, or website traffic. The goal of descriptive analytics is to present a concise overview of data that aids organizations in comprehending past events, recognizing potential areas for concern or opportunities, and utilizing data to make well-informed decisions.
The tools used for descriptive analytics differ based on an organization’s requirements, but frequently used ones are spreadsheets (like Microsoft Excel), business intelligence software (such as Tableau or Power BI), and data visualization tools (like D3.js or ggplot2).
Common techniques for descriptive data analysis include data aggregation, visualization, descriptive statistics, and data mining. Data aggregation involves grouping data together to create summaries for easier analysis. Data visualization presents data in visual formats like charts, graphs, and maps to help identify patterns and trends. Descriptive statistics use measures like mean, median, and standard deviation to summarize and describe data. Data mining uses automated techniques to search for insights in large datasets.
Descriptive analytics is useful in various areas. For example, in marketing, it may help understand customer behavior and identify trends. In finance, it may detect fraud and identify areas of financial risk. In operations, it may give insight into supply chain and inventory management issues, improve production efficiency, and reduce costs. In healthcare, it can analyze patient data or identify disease patterns.
Diagnostic Analytics
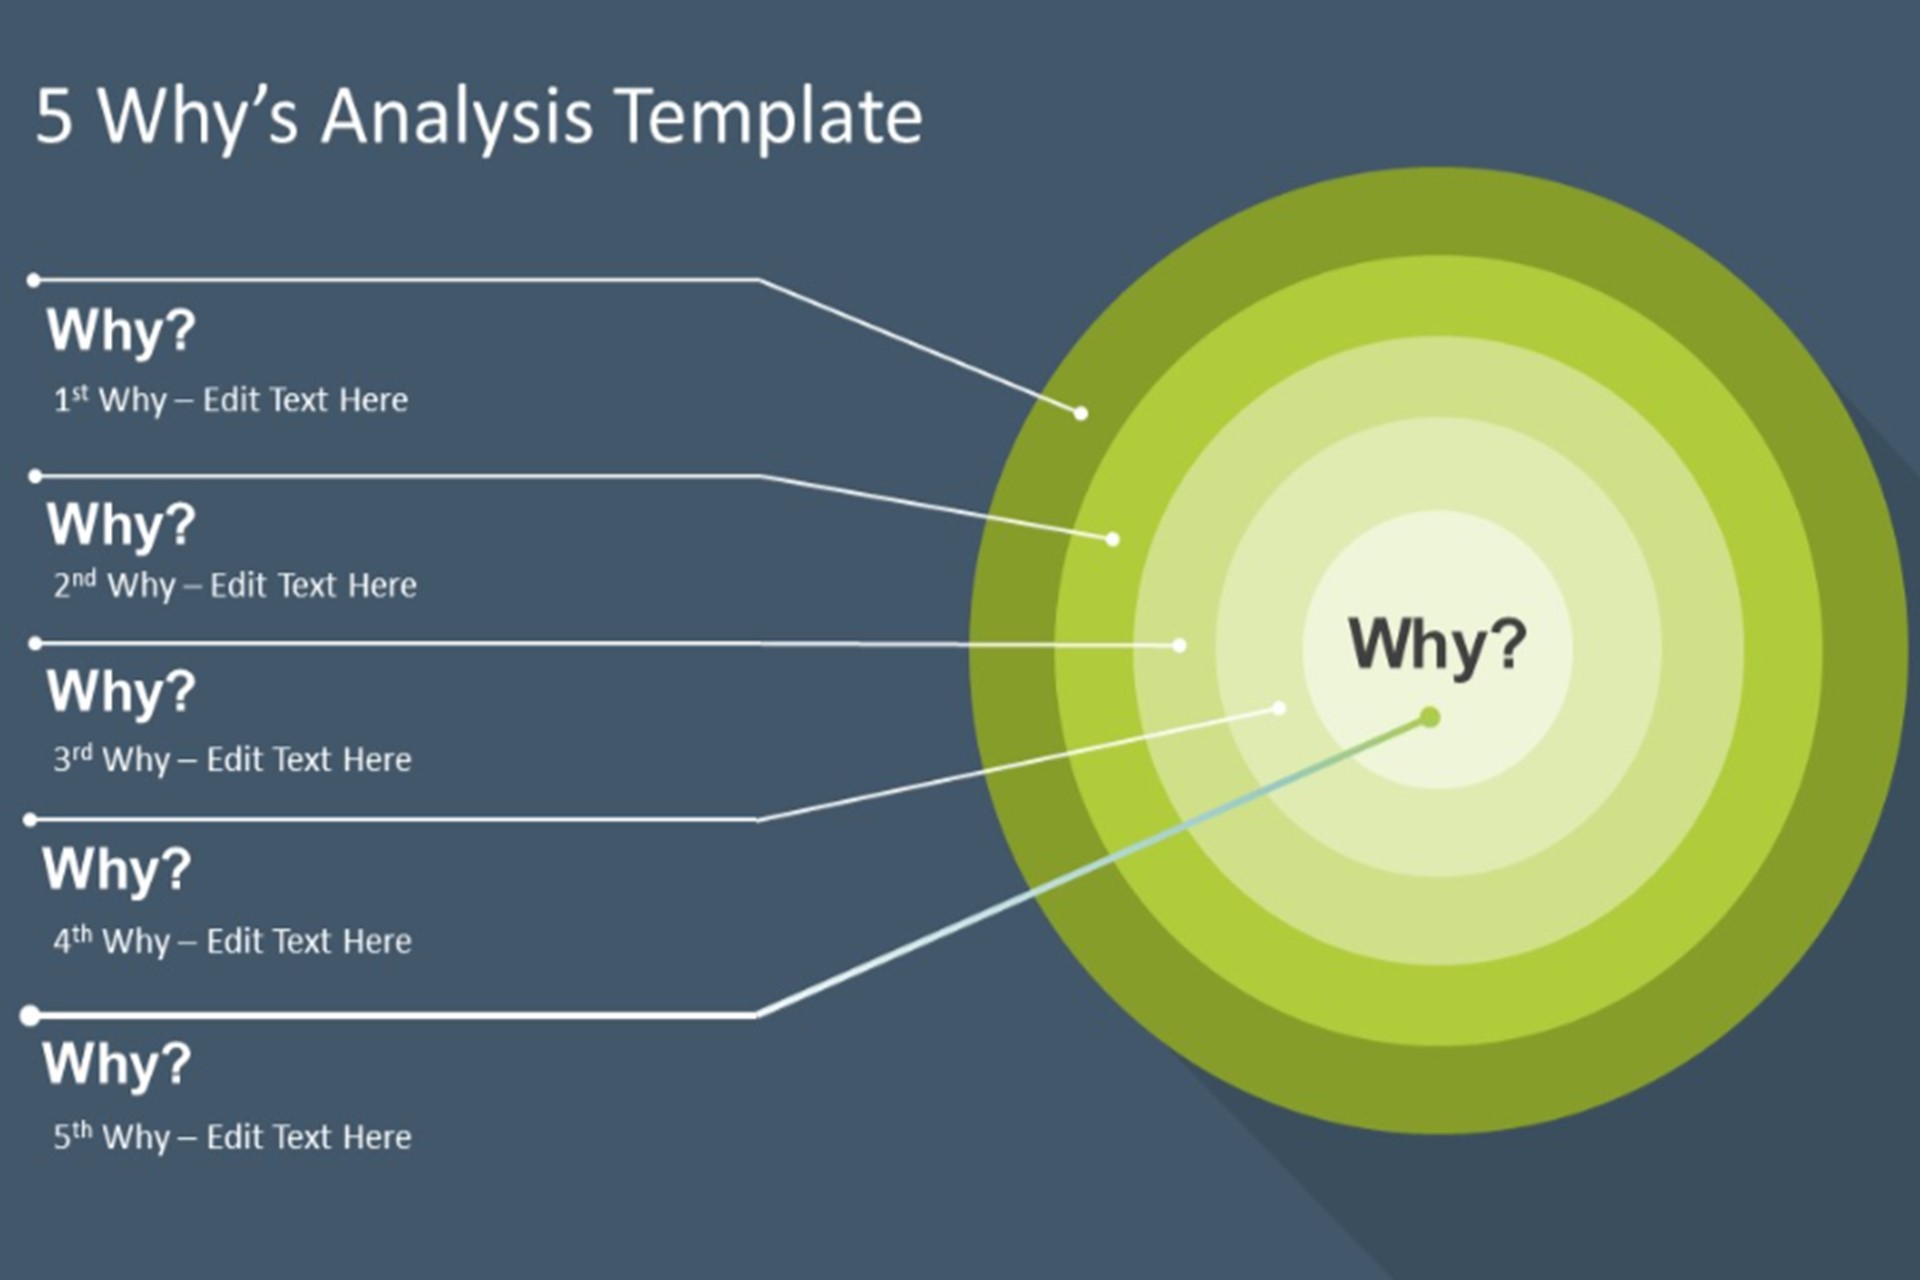
Diagnostic analytics aims to understand why a particular outcome occurred in the past by identifying the root causes of the outcome. Diagnostic analytics helps to answer questions such as “Why did it happen?” and “What factors contributed to this outcome?” Examples of diagnostic analytics include analyzing customer feedback to find areas for improvement or investigating the reason for a sudden drop in sales.
Organizations use different diagnostic analytics tools depending on their specific requirements. Some widely used tools are statistical software (like SAS or R), data mining tools (like RapidMiner), and business intelligence software (such as Power BI or Tableau).
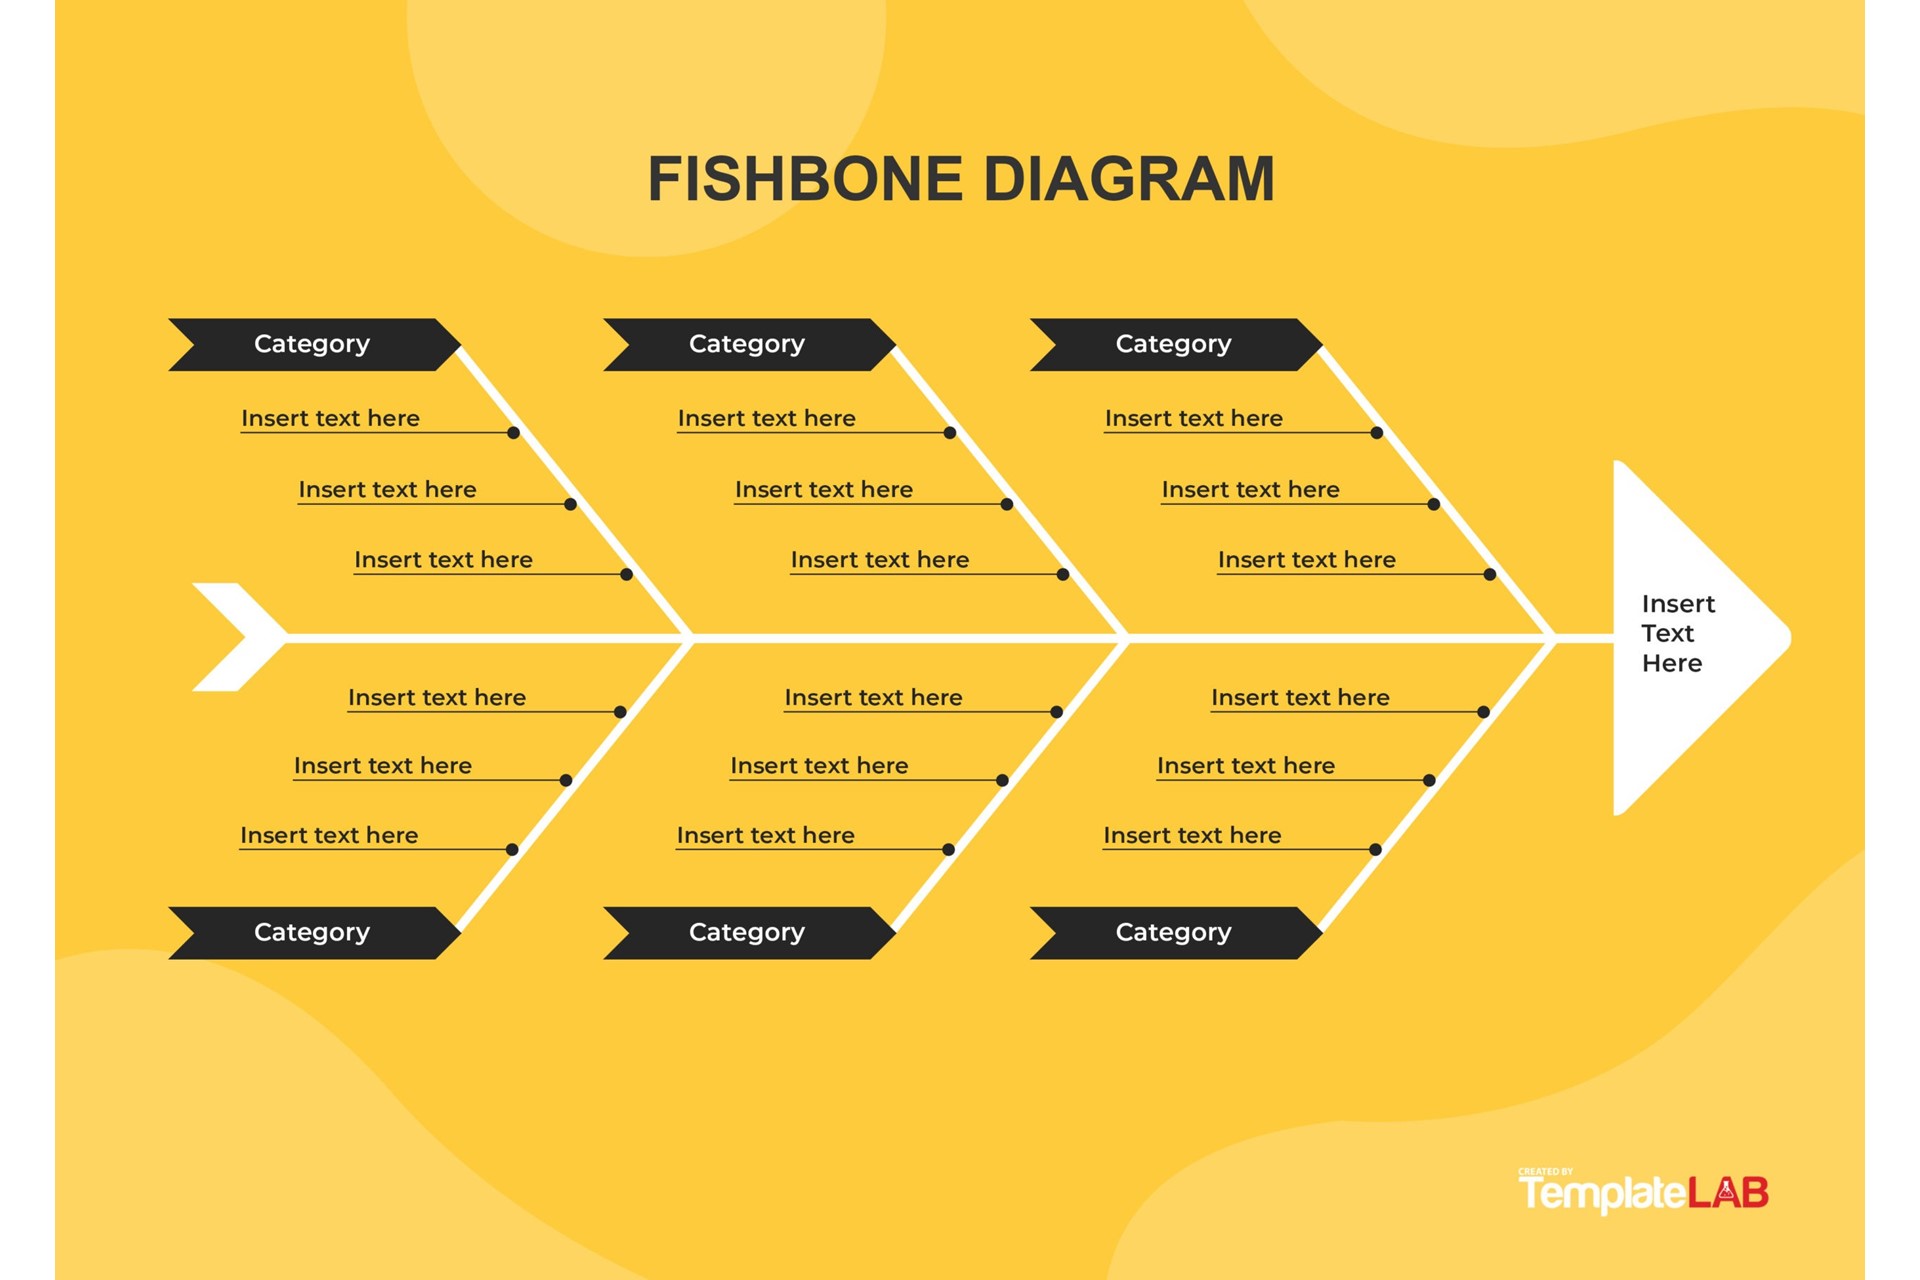
Some examples of diagnostic analytics techniques are correlation analysis, regression analysis, and data visualization. Correlation analysis involves identifying patterns and correlations between variables. Regression analysis identifies factors driving a particular outcome. Data visualization helps identify patterns and trends in data using techniques such as scatter plots, heat maps, and bubble charts.
Diagnostic analytics can be used in various areas such as manufacturing, healthcare, marketing, and finance. It helps identify the root causes of problems, reduce defects, improve diagnoses, optimize processes and campaigns, and reduce financial risk.
Predictive Analytics
Predictive analytics used statistical algorithms and historical data to predict future events. This technique involves analyzing patterns in historical data to make predictions or forecasts. Predictive analytics is useful in answering questions like “What is the probability of a specific outcome in the future” or “What is likely to happen in the future”. Forecasting future sales, identifying customers who may stop using a service, or estimating the likelihood of an event occurring are all examples of predictive analytics.
Various tools used for predictive analytics include Python and R, machine learning platforms such as Hadoop and TensorFlow, and visualization tools like Tableau or Power BI. Predictive analytics techniques such as regression analysis, decision trees, neural networks, and time series analysis. Regression analysis builds a mathematical model to predict future outcomes. Decision trees create a tree-like model to predict future outcomes. Neural networks use algorithms to recognize patterns and make predictions based on those patterns. Time series analysis analyzes historical data to identify trends and patterns over time.
Prescriptive Analytics
Prescriptive analytics offers more than just predictions about future events; it also suggests actions that can be taken to achieve a desired outcome. This involves the use of advanced algorithms and optimization techniques to determine the best course of action based on various factors and constraints. Prescriptive analytics helps answer questions like “What is the best course of action?” and “What should we do?” Some examples of prescriptive analytics include optimizing inventory levels, recommending personalized products to customers, and suggesting treatment plans for patients.
Prescriptive analytics employs a range of tools, which include Gurobi and CPLEX for mathematical optimization, AnyLogic for simulation, and TensorFlow and Hadoop for machine learning. Prescriptive analytics uses techniques such as mathematical optimization, simulation, decision analysis, and machine learning to identify the best solutions to complex problems. These techniques can be used to develop personalized recommendations for customers, optimize supply chains, and improve operations.
Summary
There are four forms of data analytics: descriptive analytics, diagnostic analytics, predictive analytics, and prescriptive analytics. Descriptive analytics is used to summarize and characterize historical data in order to provide insights into what has occurred in the past. Diagnostic analytics analyses historical data to determine the fundamental causes of problems or patterns. Predictive analytics uses historical data to estimate future events or behavior, whereas prescriptive analytics uses data and algorithms to make advice on how to accomplish a desired goal. Each of these types of data analytics has its own set of applications and benefits, which organizations can use to get important insights and make sound decisions.