When something goes wrong in your business, you need to find out why and fix it as soon as possible. But how do you know where to start? How do you avoid wasting time and resources on superficial solutions that don’t address the real problem? The answer is to conduct a root cause analysis, a systematic process that helps you identify the underlying cause of a problem and prevent it from happening again.
In this article, we will explain what a root cause analysis is, why it is important, and how to conduct one in six steps. We will also introduce some of the most popular tools and techniques that you can use to perform a root cause analysis effectively.
What is a root cause analysis?
A root cause analysis (RCA) is a problem-solving method that aims to find the origin of a problem or an issue. It involves asking questions, collecting data, and analyzing evidence to determine the root cause of a problem and its effects.
A root cause is the fundamental reason that causes a problem to occur. It is not the same as a symptom, which is a sign or an indication of a problem. For example, if your car won’t start, the symptom is that the engine doesn’t turn on. The root cause could be that the battery is dead, the spark plugs are faulty, or the fuel tank is empty.
A root cause analysis helps you avoid treating the symptoms instead of the cause. It also helps you prevent the problem from recurring or causing other problems down the line.
Why is a root cause analysis important?
A root cause analysis is important because it can help you:
- Improve your business performance and efficiency by eliminating waste, errors, defects, or failures.
- Enhance your customer satisfaction and loyalty by delivering high-quality products or services that meet their needs and expectations.
- Reduce your costs and risks by avoiding rework, downtime, accidents, or lawsuits.
- Foster your team collaboration and communication by involving your stakeholders in the problem-solving process and sharing your findings and solutions.
- Promote your continuous improvement and learning culture by encouraging your team to ask questions, challenge assumptions, and seek feedback.
How to conduct a root cause analysis in six steps?
Conducting a root cause analysis can be challenging and time-consuming. It requires a lot of data collection and analysis, as well as critical thinking and creativity. To make it easier for you, we have outlined six steps that you can follow to conduct a successful root cause analysis.
Step 1: Define the problem
The first step is to define the problem that you want to solve clearly and concisely. You need to describe what happened, when it happened, where it happened, who was involved, and what was the impact.
You can use tools such as problem statements or SMART goals to help you define the problem. A problem statement is a brief summary of the problem that answers the questions of what, where, when, who, and why. A SMART goal is a specific, measurable, achievable, relevant, and time-bound objective that describes what you want to achieve by solving the problem.
For example, if your website traffic has dropped by 50% in the last month, your problem statement could be:
“Our website traffic has dropped by 50% in the last month compared to the previous month because of poor SEO performance.”
Your SMART goal could be:
“We want to increase our website traffic by 25% in the next three months by improving our SEO performance.”
Step 2: Gather data
The second step is to gather data and evidence related to the problem. You need to collect as much information as possible to understand the current situation and identify possible causes of the problem.
You can use tools such as checklists or surveys to help you gather data. A checklist is a list of items or tasks that you need to verify or complete during data collection. A survey is a set of questions that you ask your customers, employees, or other stakeholders to get their feedback or opinions.
Checklist
For example, if your website traffic has dropped by 50% in the last month, your checklist could include:
- Reviewing your website analytics reports
- Checking your website speed and performance
- Analyzing your website content and keywords
- Comparing your website ranking and competitors
- Interviewing your website visitors or customers
Survey
Your survey could include questions such as:
- How did you find our website?
- What did you like or dislike about our website?
- How easy or difficult was it to navigate our website?
- How satisfied or dissatisfied were you with our website?
- What suggestions do you have to improve our website?
Step 3: Identify possible causes
The third step is to identify possible causes of the problem based on the data and evidence that you gathered. You need to brainstorm all the potential factors that could have contributed to the problem and organize them into categories or groups.
You can use tools such as fishbone diagrams or 5 whys to help you identify possible causes.
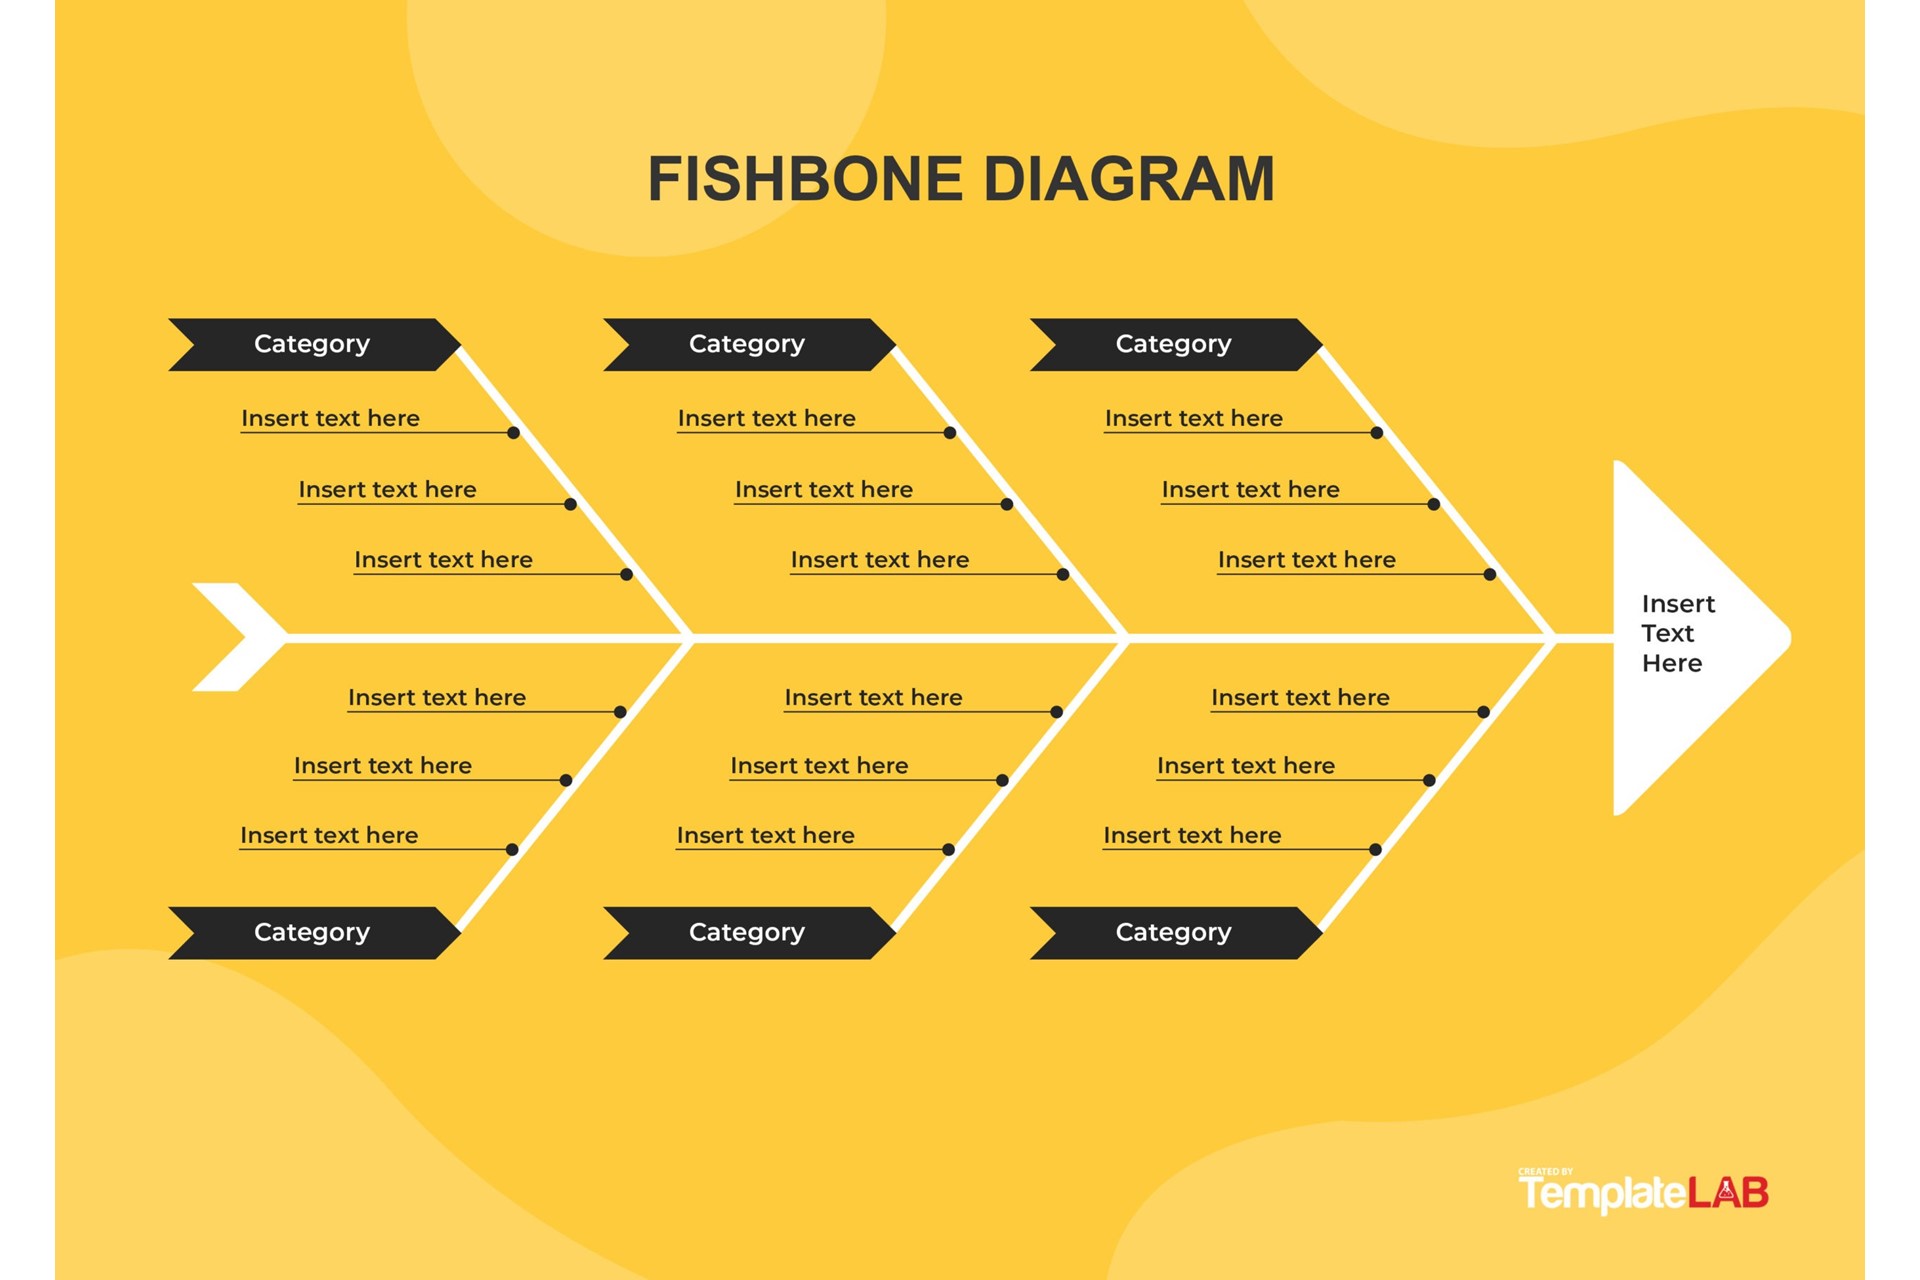
Fishbone Diagram
A fishbone diagram is a graphic tool that shows the possible causes of a problem or an outcome in a fish-shaped diagram.
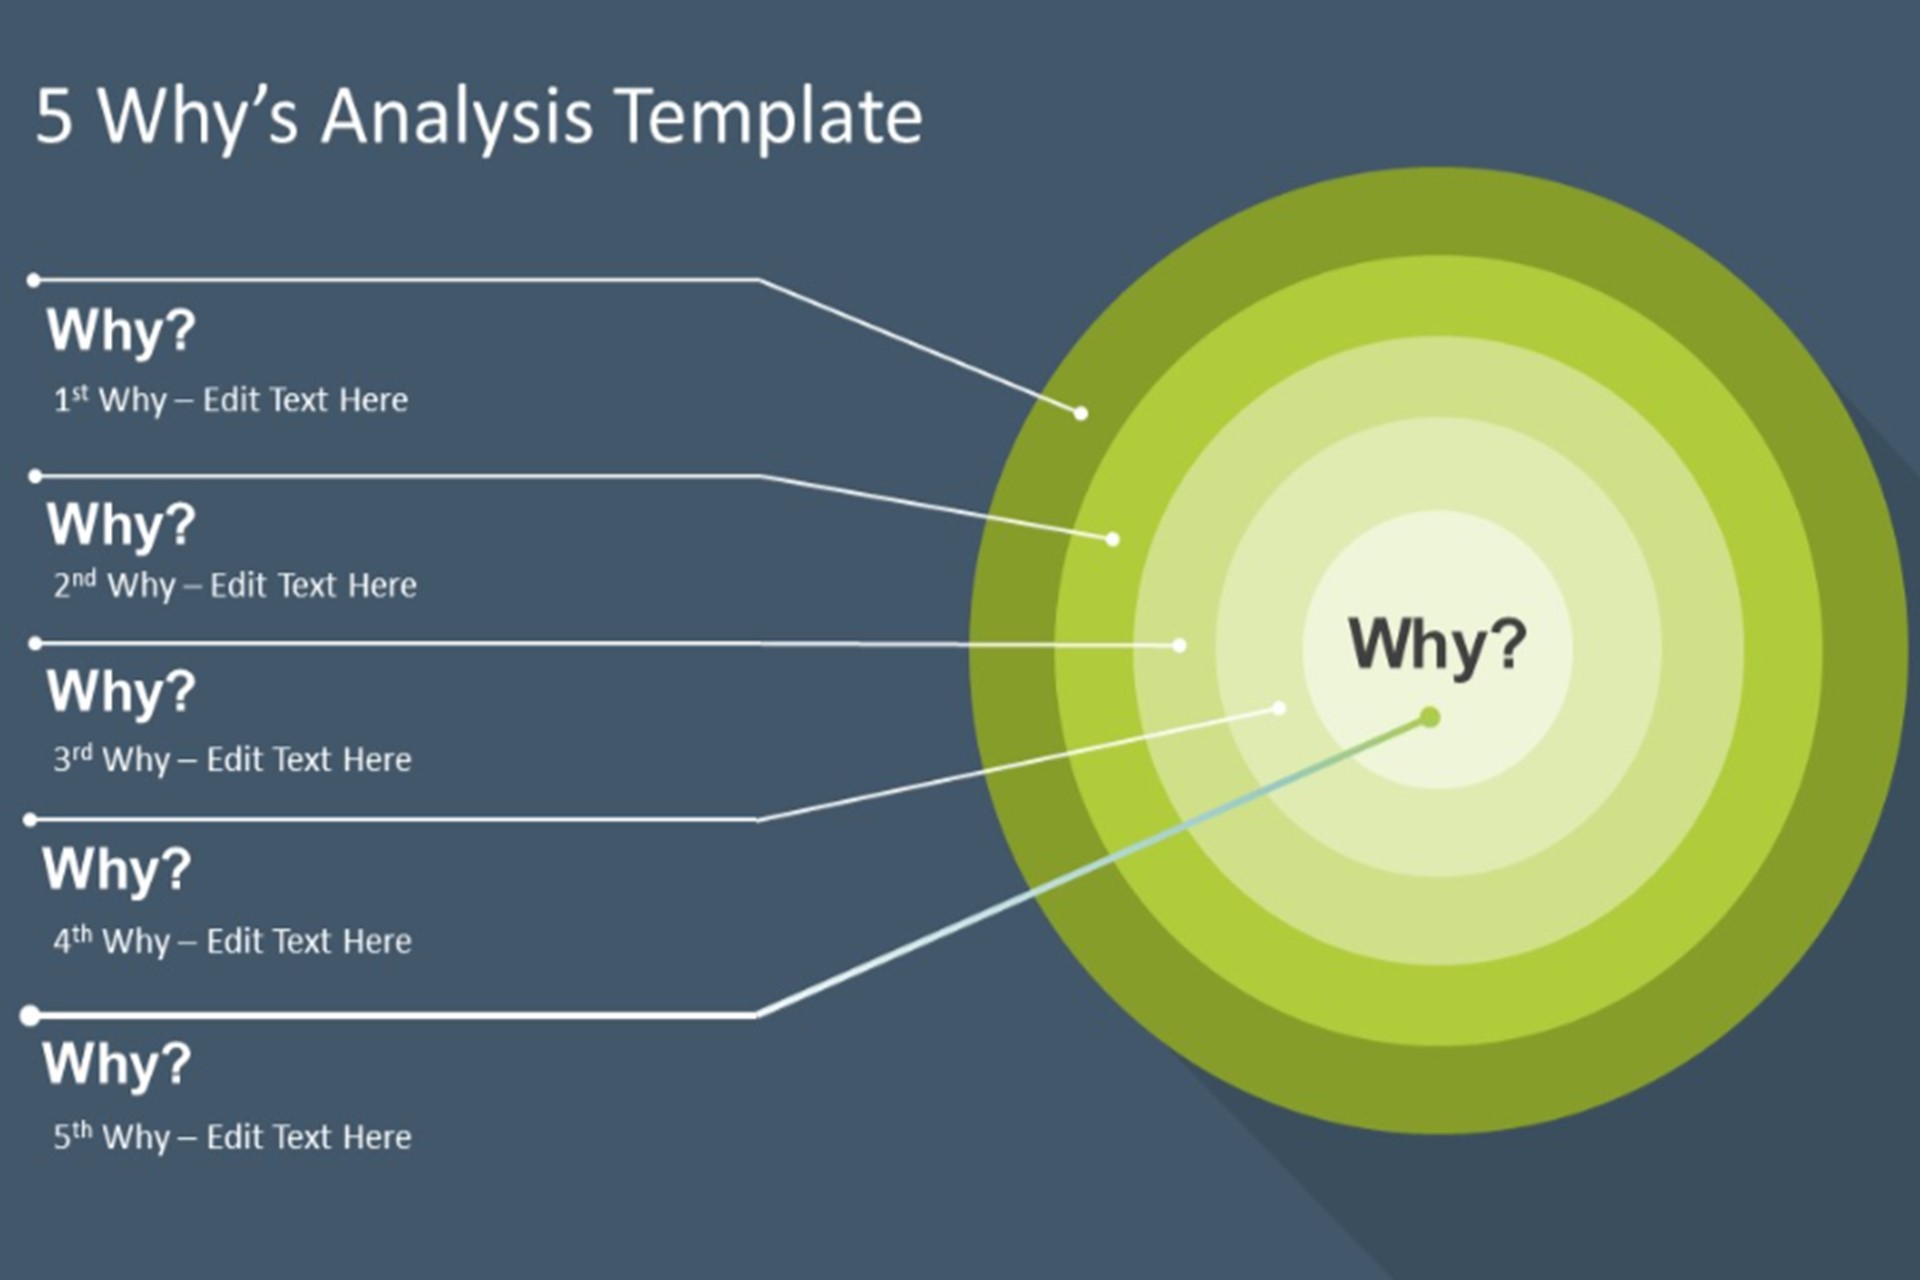
5 Whys Analysis
A 5 whys analysis is a questioning technique that asks “Why?” five times to get to the root cause of a problem.
For example, if your website traffic has dropped by 50% in the last month, your fishbone diagram could look like this:
Your 5 whys analysis could look like this:
Problem: Our website traffic has dropped by 50% in the last month.
Why? Because our ranking on Google has dropped.
Why? Because our website speed is slow.
Why? Because our hosting service is unreliable.
Why? Because we chose the cheapest option available.
Why? Because we didn’t do enough research on the best hosting services for our needs.
Root cause: We chose the cheapest hosting service without doing enough research.
Step 4: Identify the root cause
The fourth step is to identify the root cause of the problem based on the possible causes that you identified. You need to analyze the evidence and data that support or refute each possible cause and determine the most likely or significant cause of the problem.
You can use tools such as Pareto charts or scatter diagrams to help you identify the root cause. A Pareto chart is a bar graph that shows the frequency and impact of different factors or causes. A scatter diagram is a plot that shows the relationship between two variables or factors.
Step 5: Develop and implement solutions
The fifth step is to develop and implement solutions to address the root cause of the problem and prevent it from happening again. You need to brainstorm all the possible solutions that could solve the problem and evaluate their feasibility, effectiveness, and cost.
You can use tools such as SWOT analysis or decision matrix to help you develop and implement solutions. A SWOT analysis is a matrix that evaluates the strengths, weaknesses, opportunities, and threats of a situation. A decision matrix is a table that compares and ranks different options based on criteria and scores.
Step 6: Review and evaluate
The sixth and final step is to review and evaluate the impact of your solution on the problem and its effects. You need to monitor and measure the results of your solution and check if it has solved the problem or not; to collect feedback from your stakeholders and make improvements as necessary.
You can use tools such as KPIs or surveys to help you review and evaluate. KPIs are key performance indicators that track and measure the progress and success of your solution. Surveys are sets of questions that you ask your stakeholders to get their feedback or opinions.
For example, if your website traffic has dropped by 50% in the last month, your KPIs could include:
- Website speed
- Website ranking
- Website traffic
- Website conversions
- Website satisfaction
Your surveys could include questions such as:
- How fast or slow did you find our website?
- How easy or difficult was it to find our website on Google?
- How often or rarely did you visit our website in the last month?
- How likely or unlikely are you to buy something from our website?
- How satisfied or dissatisfied are you with our website after we optimized its speed?
Conclusion
A root cause analysis is a vital process that helps you find the underlying cause of a problem and prevent it from happening again. It can also help you improve your business performance and efficiency, enhance your customer satisfaction and loyalty, reduce your costs and risks, foster your team collaboration and communication, and promote your continuous improvement and learning culture.
If you want to conduct a root cause analysis, you can follow these six steps:
- Define the problem clearly and concisely.
- Gather data and evidence related to the problem.
- Identify possible causes of the problem based on the data and evidence.
- Identify the root cause of the problem based on the possible causes.
- Develop and implement solutions to address the root cause of the problem.
- Review and evaluate the impact of your solution on the problem and its effects.
You can also use various tools and techniques to help you perform a root cause analysis effectively, such as fishbone diagrams, 5 whys, Pareto charts, scatter diagrams, SWOT analysis, decision matrix, KPIs, and surveys.
We hope this article has helped you understand what a root cause analysis is, why it is important, and how to conduct one in six steps. By using a root cause analysis, you can solve problems and make decisions more efficiently and effectively.